Schedule- July 18 - July 29
M - F 9A-5P Do research
except for scheduled activities below and lunch break (even when no group lunch).
Blue = whole group. Red = food.
As long as you get your work done and attend scheduled activities
relevant to your group, you can choose when/where to work unless
instructed otherwise by your faculty mentor.
Faculty mentors have authority to excuse students from any
scheduled activity to avoid disruption of research, but someone should
notify the Director,
Dr. Minnie Catral, if a student will miss a whole group activity during the workweek.
Weekend and evening activities are optional.
Sunday July 18
Monday July 19
9 AM research
noon
Union Drive Marketplace REU student lunch menu
Tuesday July 20
9 AM
research
3:30 PM cake, chips and conversation 400 Carver
4:00 PM SACNAS discussion, 250 Carver
Wednesday July 21
9 AM research
noon
Union Drive Marketplace REU student lunch menu
Thursday July 22
9 AM research
3:30 PM cookies and conversation, 3105 Snedecor
Friday July 23
9 AM research
noon
Union Drive Marketplace REU student lunch menu
Saturday July 24
Sunday July 25
Monday July 26
9 AM research
noon
Union Drive Marketplace REU student lunch menu
8
PM
Meet outside buildings 51 & 52 Freddy for rides to Jason's 3214
Nixon Ave. for S'Mores
Simple directions from Fredrickson are to take Stange north, the first
stoplight is 24th. Right (east) on 24th, about one block past
first stop sign, until Hoover. Left (north) on Hoover, about two
blocks past first stop sign, until Wheeler. Right (east) on Wheeler,
the first left is Nixon. Left (north) on Nixon, I'm the third
house on the right. It is dark brown/green with bright red doors.
Tuesday July 27
9 AM
research
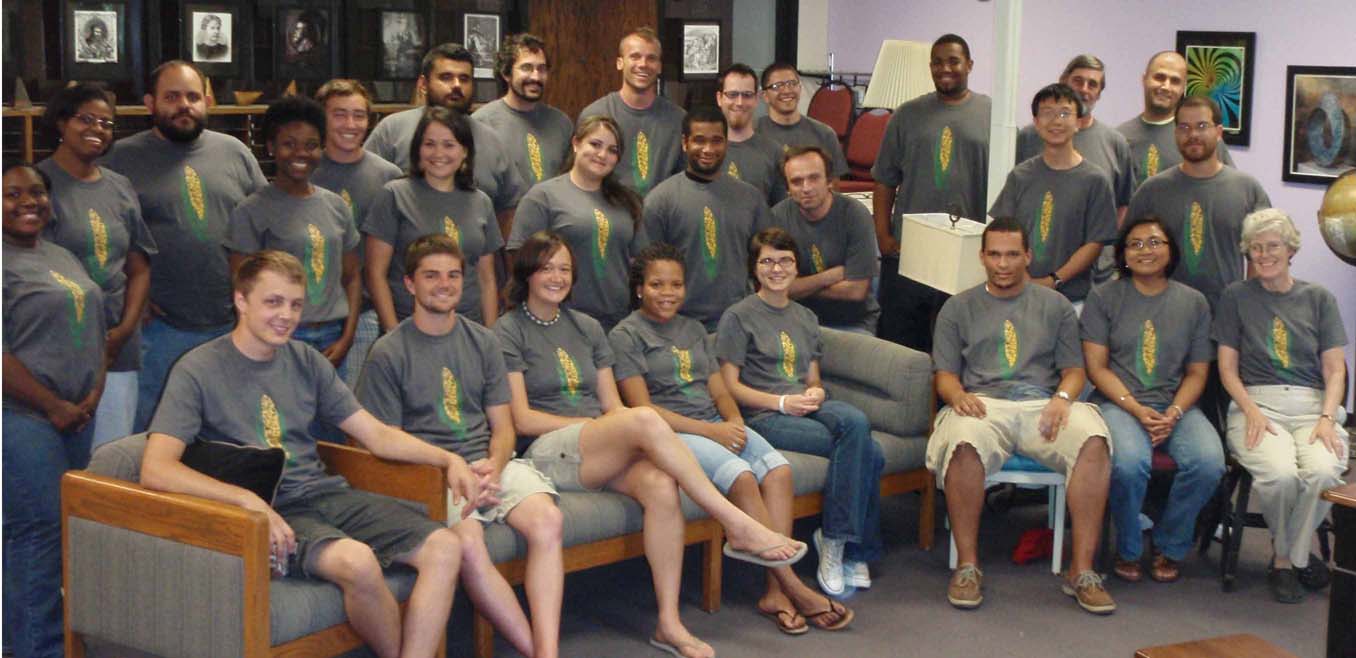
3:00 PM t-shirt pick up
3:30 PM photo in REU t-shirts
3:35 PM corn and conversation, 400 Carver
Wednesday July 28
10 AM - 9 PM Symposium Schedule Overview Detailed Schedule
Thursday July 29
8 AM - 1 PM Symposium Schedule Overview Detailed Schedule
1 - 5 PM Pack and clean
5:30 PM Farewell dinner King Buffet
Participants
Undergraduate Students
Marie
Archer
Columbia College
Millicent Grant
Spelman College
Rana Haber
Cal Poly Pomona
Ashley Johnson Florida A & M
Xavier Martinez-Rivera UPR-Mayaguez
Jared Mills
Morehouse College
Antonio Ochoa
Cal Poly Pomona
Timothy Pluta
NC State
Matthew Temba
Morehouse College
Travell Williams
Morehouse College
Brian Wu
Bowdoin College
Graduate Students
Josh Bernhard
ISU (Stat)
Brenna Curley
ISU (Stat)
Rafael Del Valle
ISU (Math)
Craig Erickson
ISU (Math)
Katrina Harden-Williams ISU (Stat)
Takisha Harrison
ISU (Stat)
Maria
Neco
UPR-RP
Reza Rastegar ISU (Math)
Jason Smith
ISU (Math)
Hector Torres-Aponte UPR-RP
Chad Vidden
ISU (Math)
Faculty
Minerva Catral
ISU (Math)
Leslie
Hogben
ISU (Math)
Mark
Kaiser
ISU (Stat)
Peng Liu
ISU (Stat)
Fred Lorenz
ISU (Stat)
Dan Nettleton ISU (Stat)
Dan Nordman ISU (Stat)
Alex Roitershtein ISU (Math)
Zhengyuan Zhu
ISU (Stat)
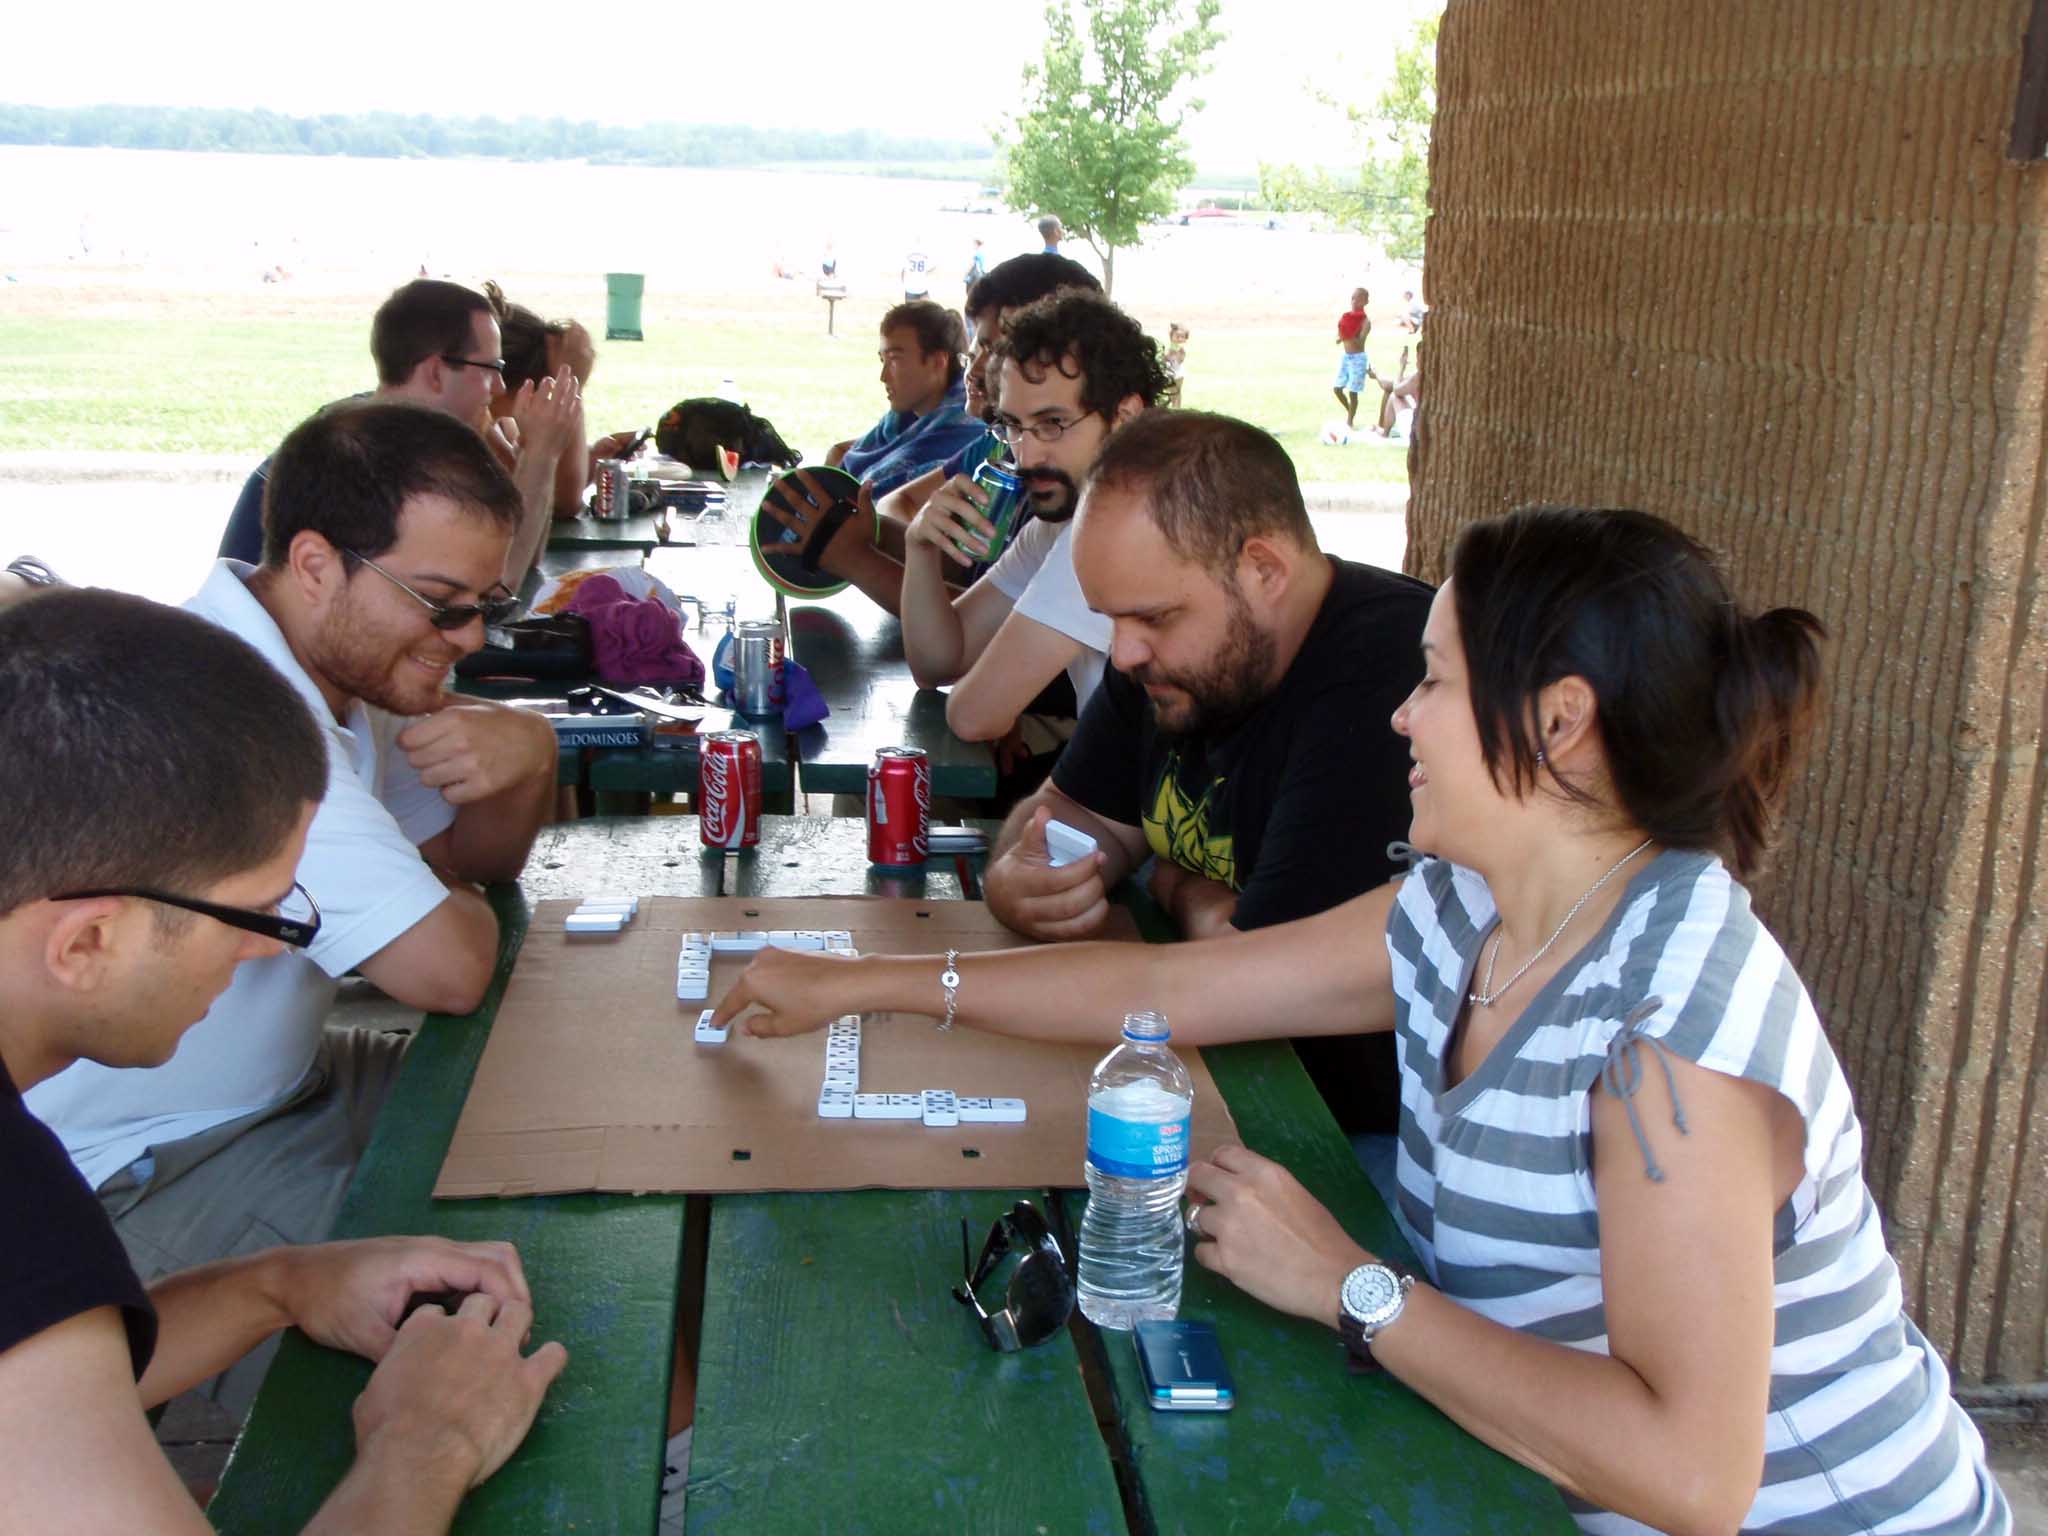
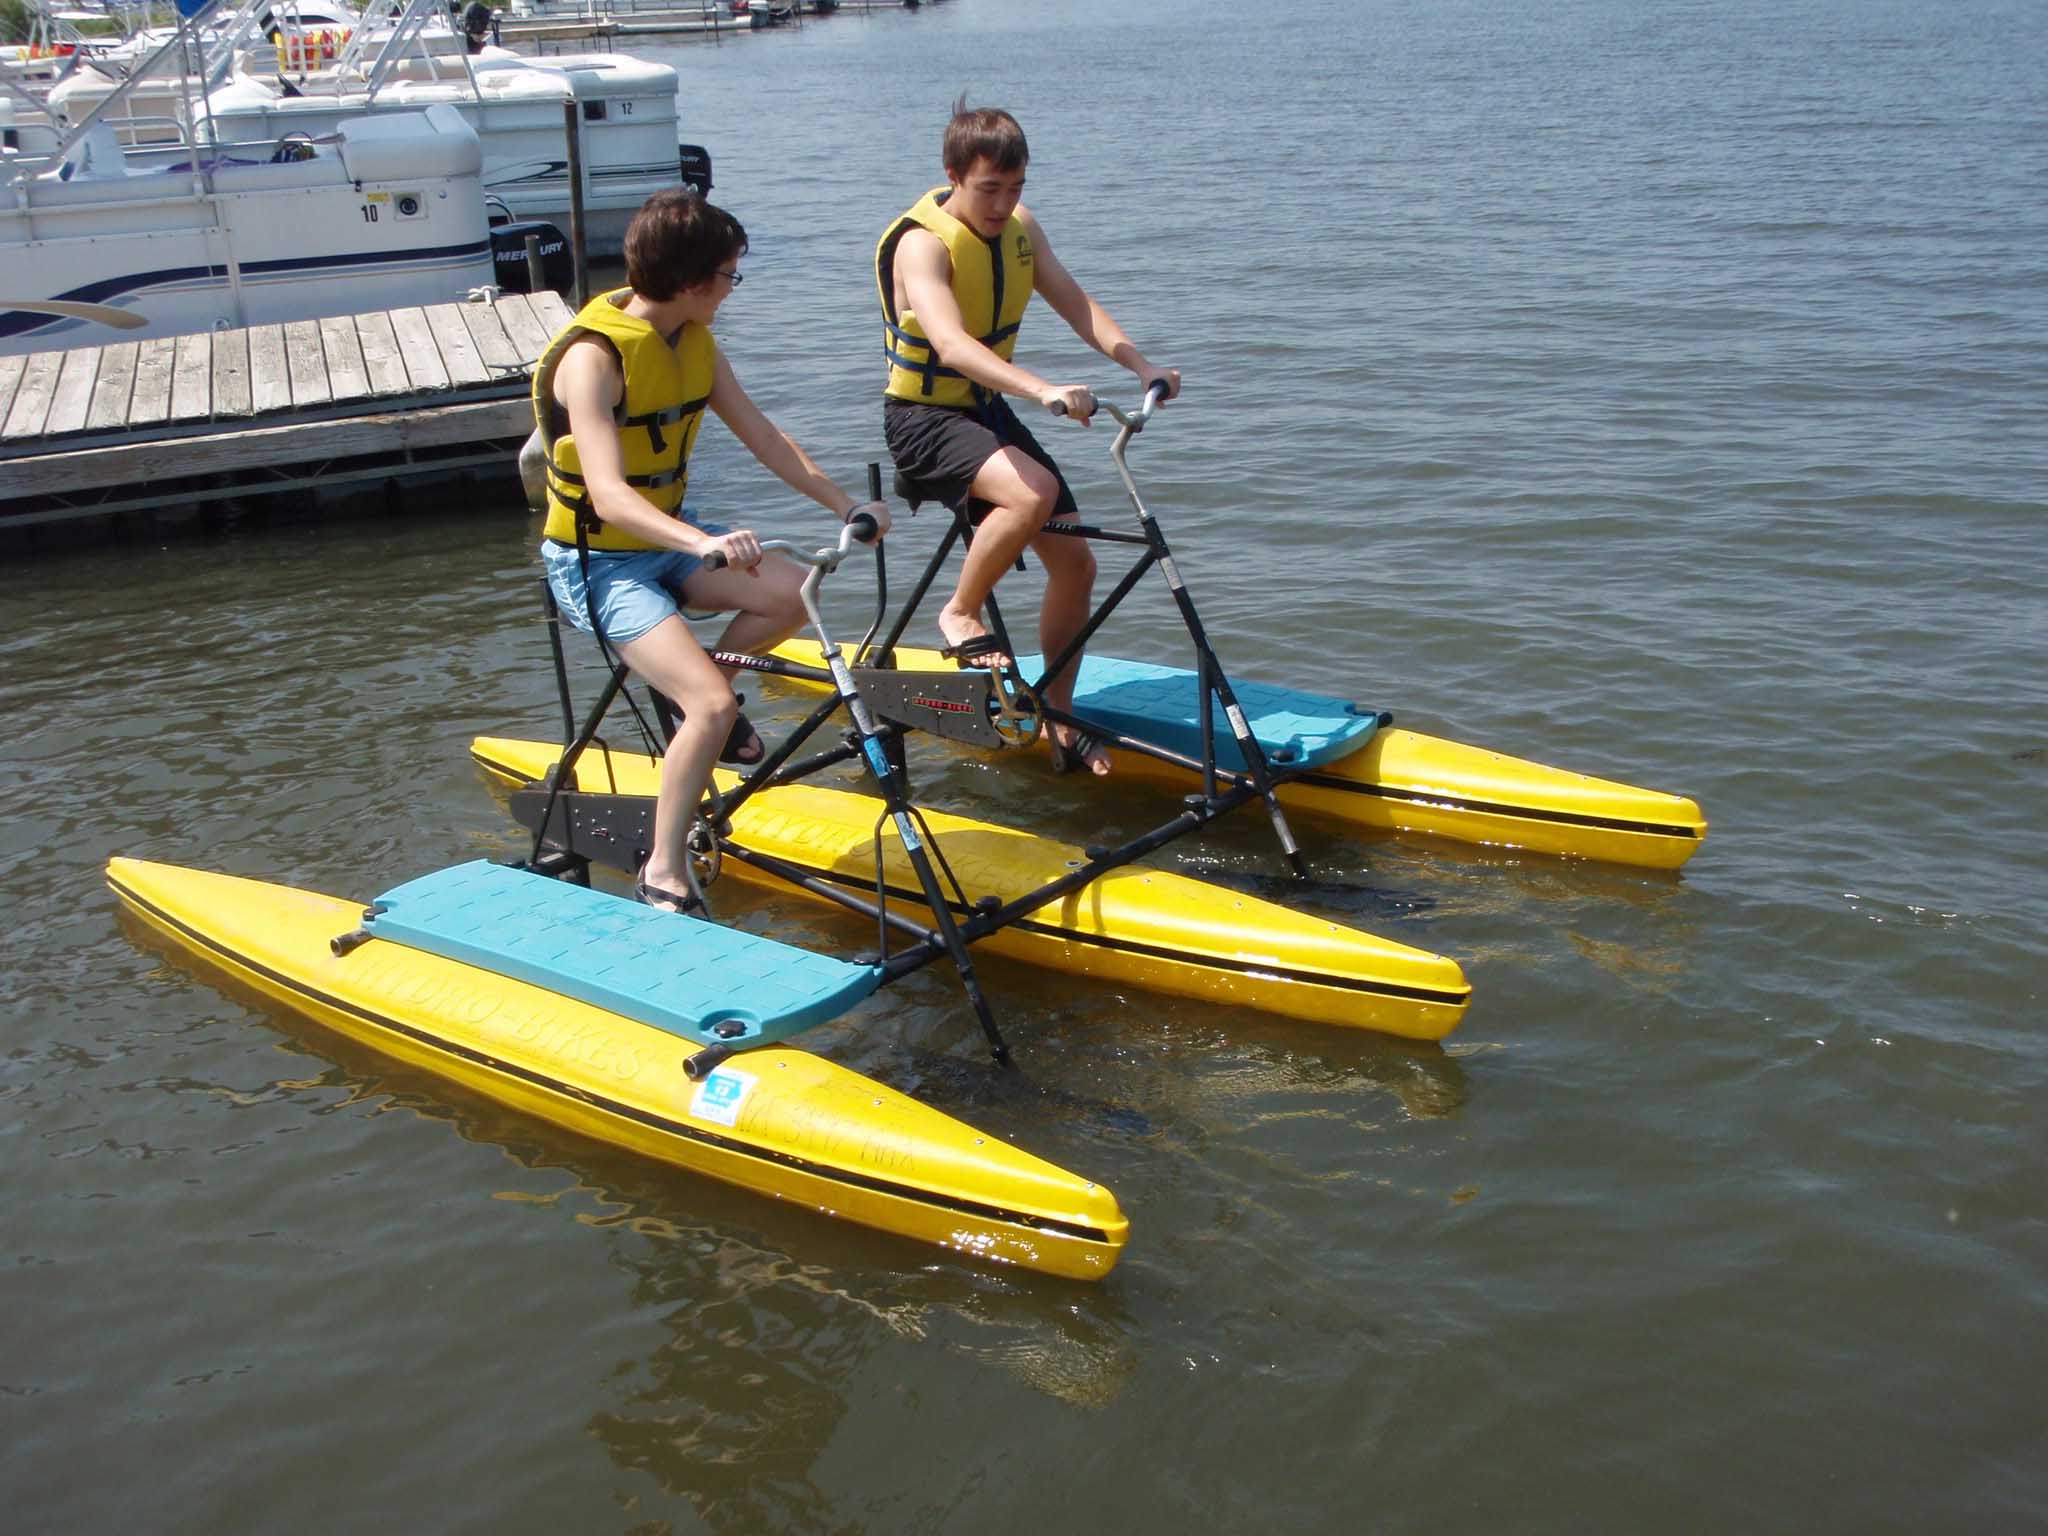
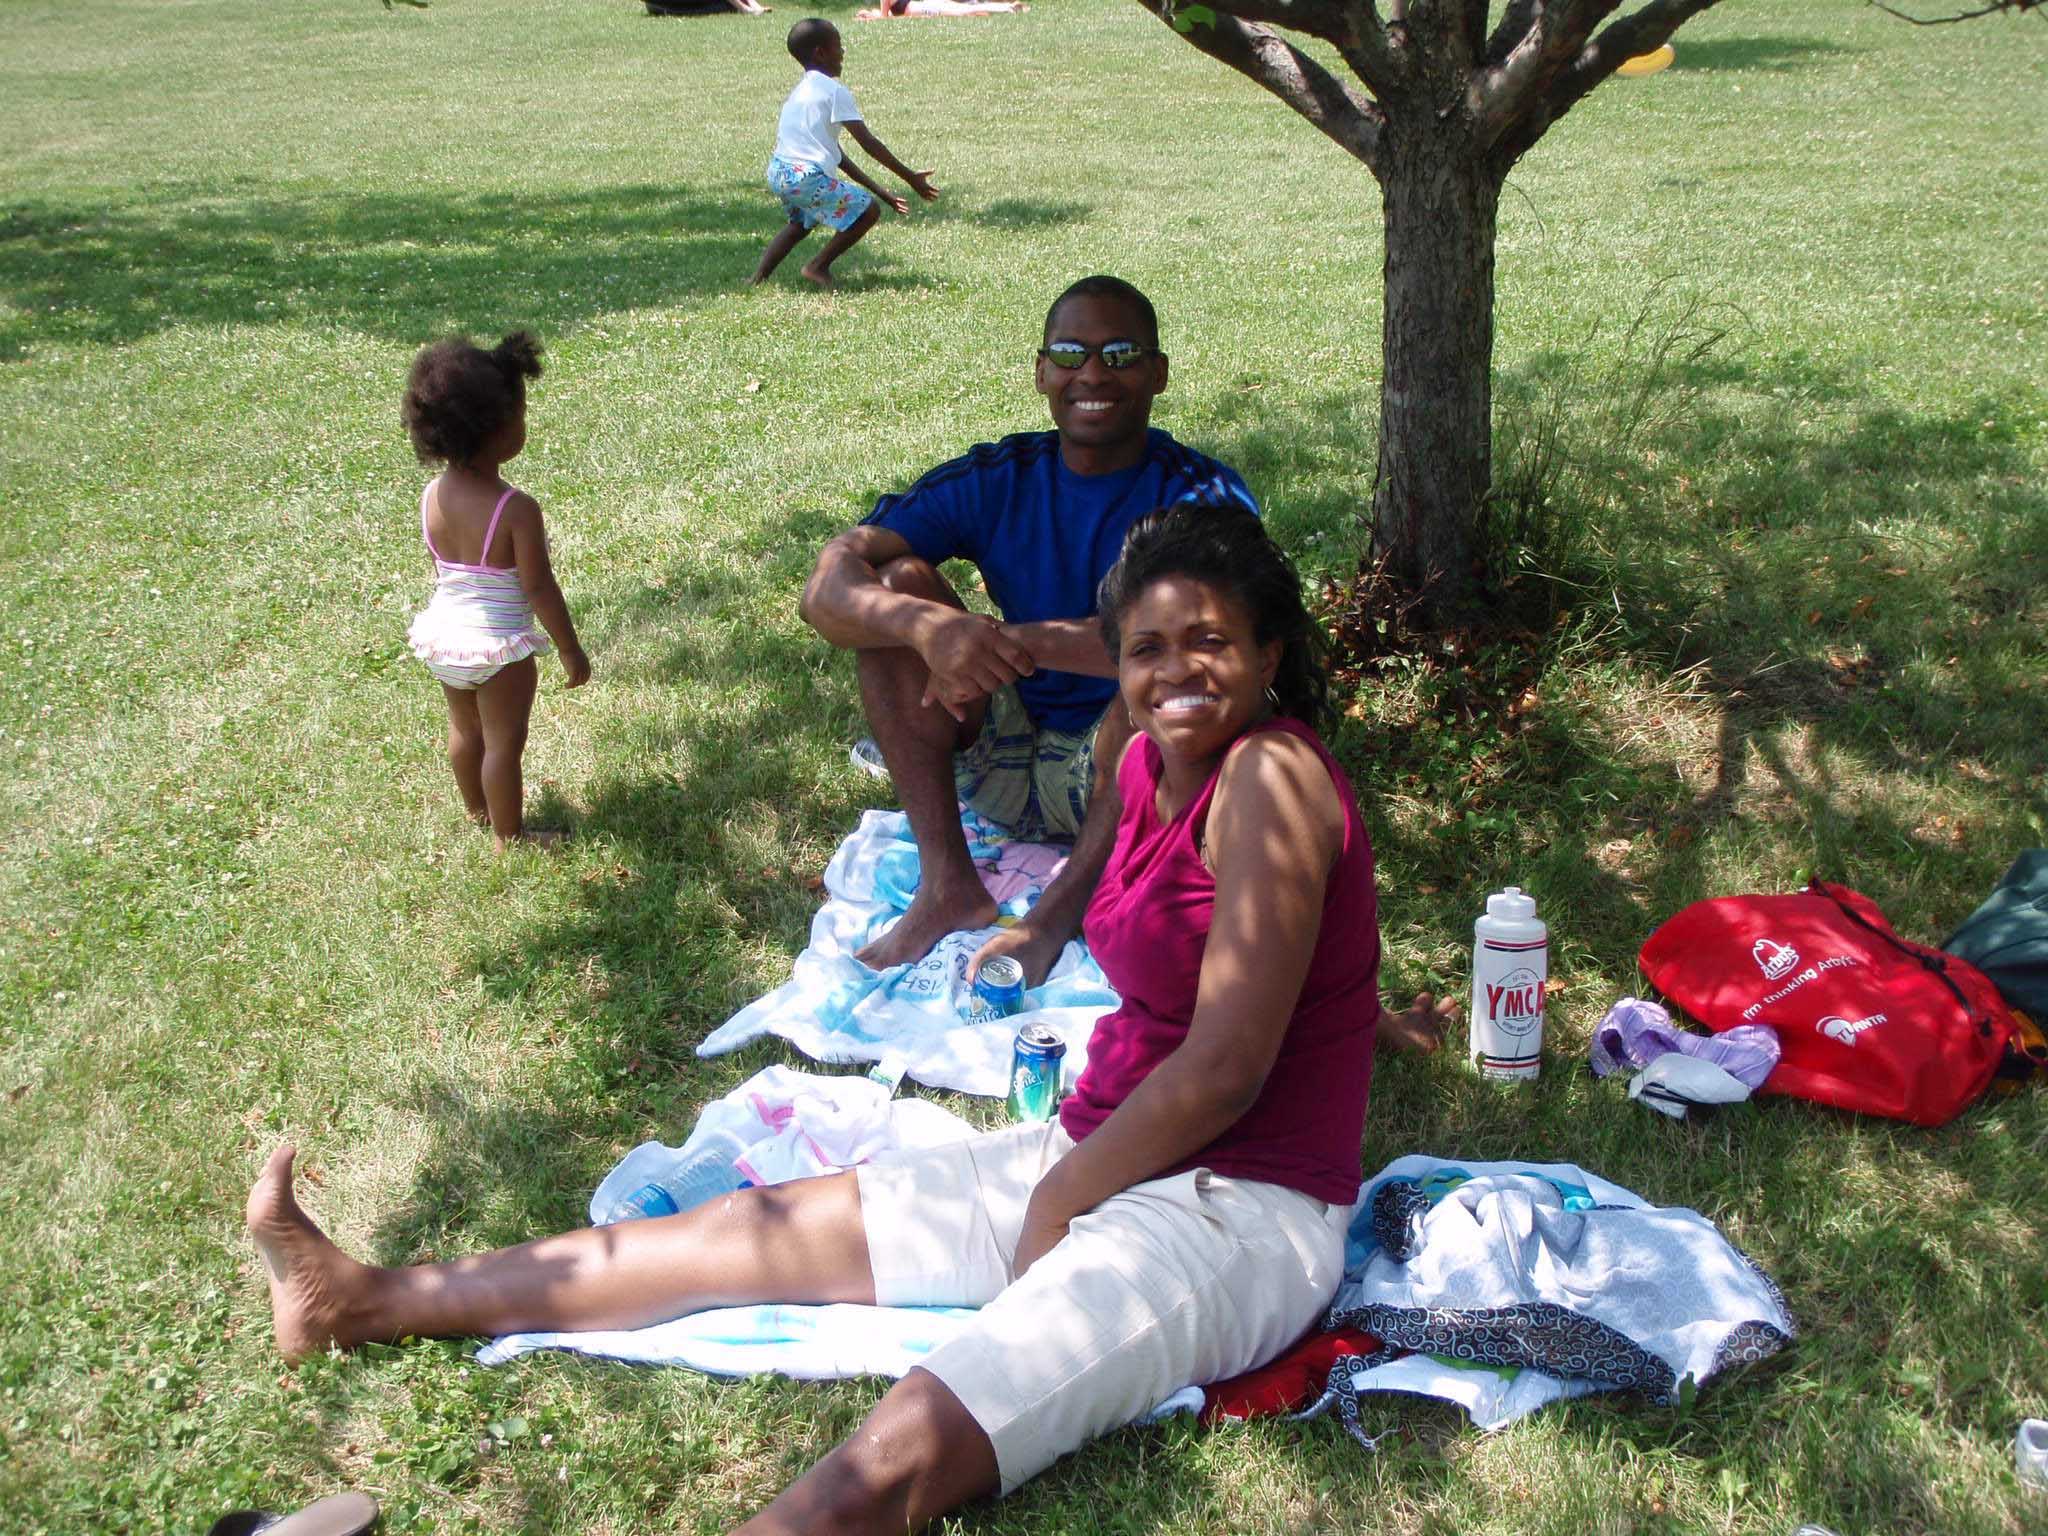
Photo(s) of the week
(for more pictures go to the photo URL)
Independence Day Picnic
Useful Links
Maine blueberry cake recipe
Leslie's 2009 Alliance grant slides
LaTeX template Figure for template Beamer template
NSF
REU sites
AMS Undergrad
page
MAA Undergrad page
SACNAS National Conference
Young
Mathematicians Conference
Involve
SIAM Undergraduate Research Online (SIURO)
Rose-Hulman
Undergraduate Math Journal
Journal of Young Investigators
Matlab
Information has links to Matlab guides
Math Project Descriptions 2010
Random walks in a game-theoretic environment Dr. Alexander Roitershtein
The project focuses on the analytical study of a class of
self-interacting random walks. The random walks that we consider are on
an integer lattice and are nearest-neighbor, that is all the steps are
of the length one. In contrast to the usual setting we assume that
there are two walkers (players) rather than one. The steps of the
random walk are determined by the joint decision made in a "Stochastic
Game" between players. The players receive rewards for any strategy
that they choose, and each player's goal is to maximize the expectation
of his total reward.
The project is in the intersection of two fascinating mathematical
areas, probability theory and game theory. No prior knowledge of any of
them is required. A decent proficiency with the Calculus and any basic
course in probability taken in the past would be an advantage. The
project might (or might not) involve simulations in MATLAB.
Eventually Nonegative Matrices and Sign Patterns Dr. Minnie Catral and
Dr.
Leslie Hogben
The square real matrix A is eventually nonnegative if there is a
positive integer k 0 such that for every k > k_0, A^k > 0. A
sign pattern is a matrix whose entries are elements of {+,
-,0}; it describes the set of real matrices whose entries have the
signs in the pattern. This project investigated sign patterns that
allow eventually positive or eventual;ly exponentially positve matrices.
Zero forcing on hypercubes Dr.
Leslie Hogben
Initially a subset Z of the vertices of a graph G are colored black
and the remaining vertices are colored white. The color change
rule is
that if a black vertex v has exactly one white neighbor w, then change
the color of w to black. The set Z is a zero forcing set if
after
applying the color change rule until no more changes are possible, all
the vertices of G are black. The zero forcing number is the
minimum
size of a zero forcing set. Zero forcing arose in the study of
determining the minimum
rank/maximum nullity among real symmetric matrices having nonzero
off-diagonal positions described by the edges of a given graph (the
zero forcing number is an upper bound for maximum nullitty.
This project was proposed by students and investigated zero forcing
numbers of cut complexes of hypercubes.
ISU Stat REU
Each statistics participant has an
individual project that s/he investigates under the supervision of
faculty and graduate student mentors. Possible projects are listed below.
ISU Stat Project Descriptions 2010
Spatial Sampling Design with Ancillary Information Dr. Zhengyuan Zhu
In many applications one need to observe a random process over some
space at a set of sample locations, and make inference about some
functions of the process. Examples include surveys of soil materials,
air pollution monitoring, ecological survey, Geological Survey for Oil
and Gas Resources, etc. Since the number of locations one can sample is
almost always constrained by available resources, it is of great
importance to find efficient spatial sampling design which can lead to
accurate and unbiased inference. In practice, ancillary information is
often available which is related to the variable of interests. For
example, in digital soil mapping, the soil properties of interests are
related to some ancillary soil and environmental variables which can be
obtained cheaply over large areas through remote sensing. We will
study how to use ancillary information to improve the efficiency of
spatial sampling, and develop innovative design approaches which can be
implemented in practice. A digital soil mapping dataset will be used
as a test bed to compare different approaches. This project will involve statistics and computation.
Development of Statistical and Computational Methods for Analysis of RNAseq Data Dr. Peng Liu
The next-generation sequencing technology allows digital
measurements of gene expressions. The resulting RNAseq data provide
much richer data about gene expressions than microarray technologies
and calls for novel statistical analysis. This summer research project
involves the development of statistical and computational methods for
assessing RNAseq data. The project will involve descriptive and
inferential statistics about RNAseq data and some computational
activity.
Analysis of Data from the Family Transition Project Dr. Fred Lorenz
During the past two decades, the Family Transition Project
has been following a panel of over 500 rural Iowa families. The
objectives are to study family resilience to economic and family
stress and to trace
continuity in behaviors between one generation and the next. Lorenz's
specific interests are in modeling change over time and in modeling the
relationship between observer ratings and questionnaire reports of
behavior.
Statistical Analysis of Microarray Data on Gene Expression Dr. Dan Nettleton
Microarray technologies allow researchers to simultaneously measure
the expression of thousands of genes in multiple biological
samples. By examining how genes change expression across
different types of samples or
samples collected under different conditions, researchers gain clues
about how genes act together to carry out important biological
processes. Genes can be organized into groups based on past
research. Genes in a group may share a function or act together
in the same biological process. Researchers often
wish to learn whether known groups of genes change their behavior in
response to new conditions. This summer research project involves
the development of statistical and computational methods for assessing
evidence of group expression change in response to stimuli. The
project will involve mathematics, statistics,
and computation. Although biological data will be used, no special background in biology is required.
The Effect of Nonconstant Variance on Spatial Prediction Dr. Mark Kaiser
Spatial prediction of phenomena such as weather variables, groundwater
contamination, or mineral deposits (and many more) is often approached
through the use of what statisticians call {\it geostatistical}
methods. The standard form of predictors developed in a
geostatistical analysis make a number of simplifying assumptions about
the process being observed. In particular, it is often assumed
that the process has a constant mean across all locations, a constant
variance across all locations, and a covariance that depends only on
distance (rather than, for example, direction). Of these, a good
deal of work has been conducted on what happens when the assumptions of
constant mean and covariance depending only on distance are
violated. Much less is known about the effects of nonconstant
variance. The goal of this project, most likely to be approached
through Monte Carlo simulation, is to investigate the behavior of the
standard methods when the true process being modeled has constant mean
and covariance depending only on distance, but violates the assumption
of constant variance. To undertake this project, the student will
need to become familiar with basic geostatistical tools such as
variograms and kriging predictors, and will be required to develop the
skills needed to conduct a simulation study using the language R.
Estimating Water Quality Through Subsampling Dr. Mark Kaiser and
Dr. Dan Nordman
Limnology is the study of lakes, focusing largely on the variables
that govern the water quality in lakes, both natural and manmade
(called reservoirs). Limnologists often sample a lake several (3
or 4) times during the summer and compute a ``seasonal mean'' as the
average, and that value may be judged against water quality standards
or regulations to determine the status of a lake.
There are questions about what a seasonal mean actually represents
relative to what happens in a lake over the course of a year.
This project will use data from a study in which 3 lakes were sampled
every day from mid-May to mid-September. The data form a time
series, as illustrated for one of the lakes in Figure 1 for the
variables of phosphorus and chlorophyll (two of the primary indicators
of water quality). Even visual examination of these plots
suggests that the values of these variables over time should not be
considered independent. In addition, what is the true mean, that
limnologists attempt to estimate by sampling 3 or 4 particular
days?
In this projet we will apply a statistical technique called subsampling
to estimate the mean over the entire data record and provide a measure
of uncertainty (standard error) for that estimate. The basic idea
is to use portions of the data record (subsamples) that are short
enough to give sufficient replication (number of subsamples) but long
enough to preserve the dependence structure of the entire data record
within each subsample. We can then examine a number of sampling
strategies that might be used by limnologists through a Monte Carlo
study. This project will introduce students to statistical
dependence in time series, the techniques of subsampling, and hopefully
an assessment of practical value for scientists and managers.
Mathematics
Department
Homepage
Web page maintained by Leslie
Hogben